AI visibility measurements describe the conditions under which an answer was collected. Those conditions include the model, question, market and account context. This study examines account context by comparing neutral sessions with accounts carrying controlled usage histories. The same study questions were asked across conditions, without adding persona descriptions to the questions. Repeated observations allowed us to assess whether the resulting recommendation differences exceeded ordinary variation.
Direct answer: In this controlled study, history-primed and neutral temporary sessions produced different recurring brand shortlists beyond normal variation for ChatGPT and Gemini. Across eligible comparisons, 75% of recurring brands were shared and 25% differed. Perplexity was borderline after correction. Claude's final shortlist did not show a detected difference, although brand names appeared more often in its searches.
Web edition revised September 8, 2026 · Based on Version 1.0 · Not peer reviewed
Download Version 1.0 · View the Zenodo record · DOI 10.5281/zenodo.22161044
| Study size | Providers | Personas | Prompts | Surfaces | Collection |
|---|---|---|---|---|---|
| 8,609 successful responses | ChatGPT, Claude, Gemini and Perplexity | 6 controlled personas | 30 prompts | Cold API, neutral Temp and history-primed | 9 days in the UK |
1. What the study found
AI recommendations vary from one answer to the next, even when the user and question stay the same. The analysis first measured that normal variation, then asked whether neutral temporary and history-primed sessions differed by more than that baseline.
The main measure was the recurring shortlist, called the stable core in the paper. A brand entered this set when it appeared in at least half of the repeated answers for a prompt, provider, persona and surface. This filters out one-off mentions before comparing account types.
That threshold changes what the result means. The study does not count every brand that appeared somewhere in the long tail. It compares the names that returned often enough to describe a repeatable recommendation pattern. A single answer can miss some of those brands or make an occasional mention look more important than it is.
| Recurring shortlist measure | Average |
|---|---|
| Brands in the history-primed recurring shortlist | 3.7 |
| Also present in the neutral temporary shortlist | 2.8 |
| Different between the two account types | 0.9 |
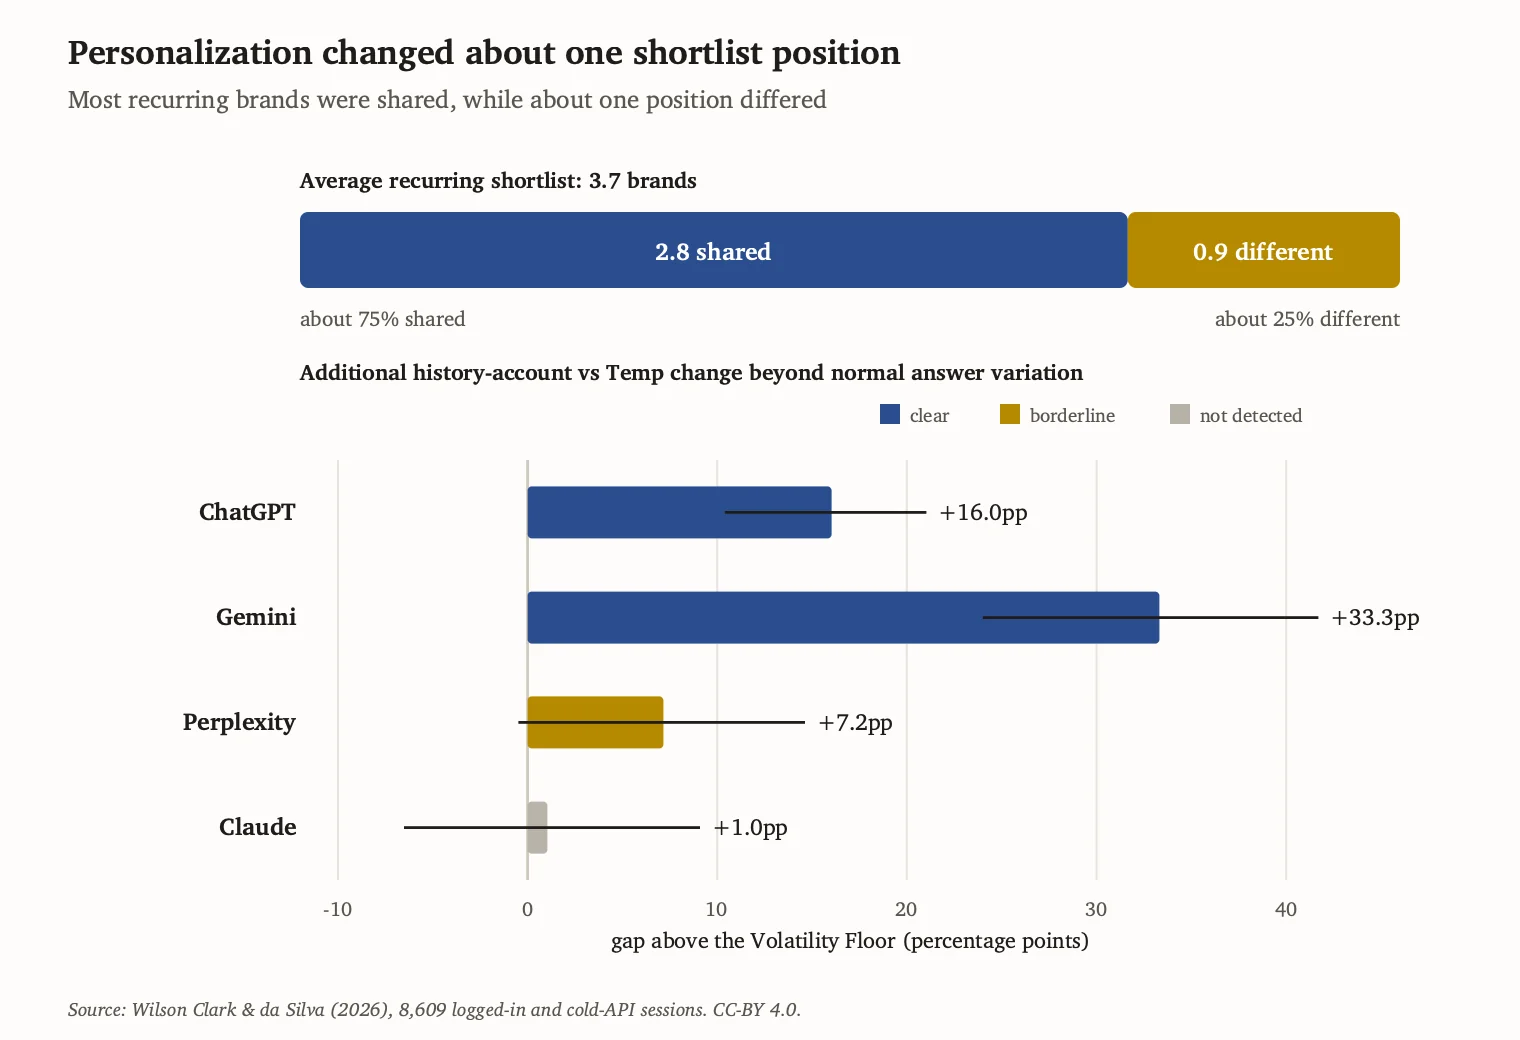
The 75% shared and 25% different result applies to recurring brands in 164 eligible comparisons. It is based on the average history-primed and shared shortlist sizes, and is separate from the test against normal variation. It does not describe every passing brand mention in all 8,609 answers. An analysis that retained all 240 starting comparisons preserved the provider-level conclusions.
On average, about one place in the recurring shortlist differed. That sounds small when the full list is the unit of analysis. For the brand occupying that place, the distinction is concrete: it appeared reliably in one account type and did not enter the recurring shortlist in the other. The analysis shows a difference in what users saw, not which set of recommendations was better.
2. What we compared
The same questions reached the same selected provider models through three routes. Prompt text, UK market and target location stayed aligned. The amount of account context changed.
| Measurement surface | What it captured |
|---|---|
| Cold API | A web-enabled API call without a user account, browser session or persistent history. |
| Neutral Temp | A logged-in temporary or incognito session that did not retain persistent history. |
| History-primed | A regular logged-in session on a separate study account with a controlled usage history. |
What a synthetic profile means in this study
In this study, a synthetic profile is a researcher-defined user context expressed through a study account with an established, profile-consistent history. The recommendations are responses collected from the providers’ consumer interfaces. These profiles represent controlled study cases; their correspondence with wider customer populations requires separate validation.
Six controlled personas covered skincare, HR software and children's gifts, with two personas assigned to each category. The thirty prompts included broad how-to questions, best-of and comparison questions, and purchase-intent questions. Persona identity was not written into the prompt, so neutral and history-primed accounts received the same question text.
The study did not compare account priming with persona descriptions added to prompts. That comparison remains a question for further research.
All browser and API traffic originated from UK IP addresses. The API calls used a residential proxy aimed at the same target location as the browser collections. This kept geography aligned while the route and account context changed.
The main personalization test compared history-primed and neutral temporary sessions because both were logged-in browser surfaces. The API analysis asked a different question: how much of the history-primed recurring shortlist could a scalable, history-free collection recover?
3. Each provider showed a different personalization profile
The same account context affected the shortlist, first recommendation, searches and sources differently across providers. A single pooled score would hide those patterns.
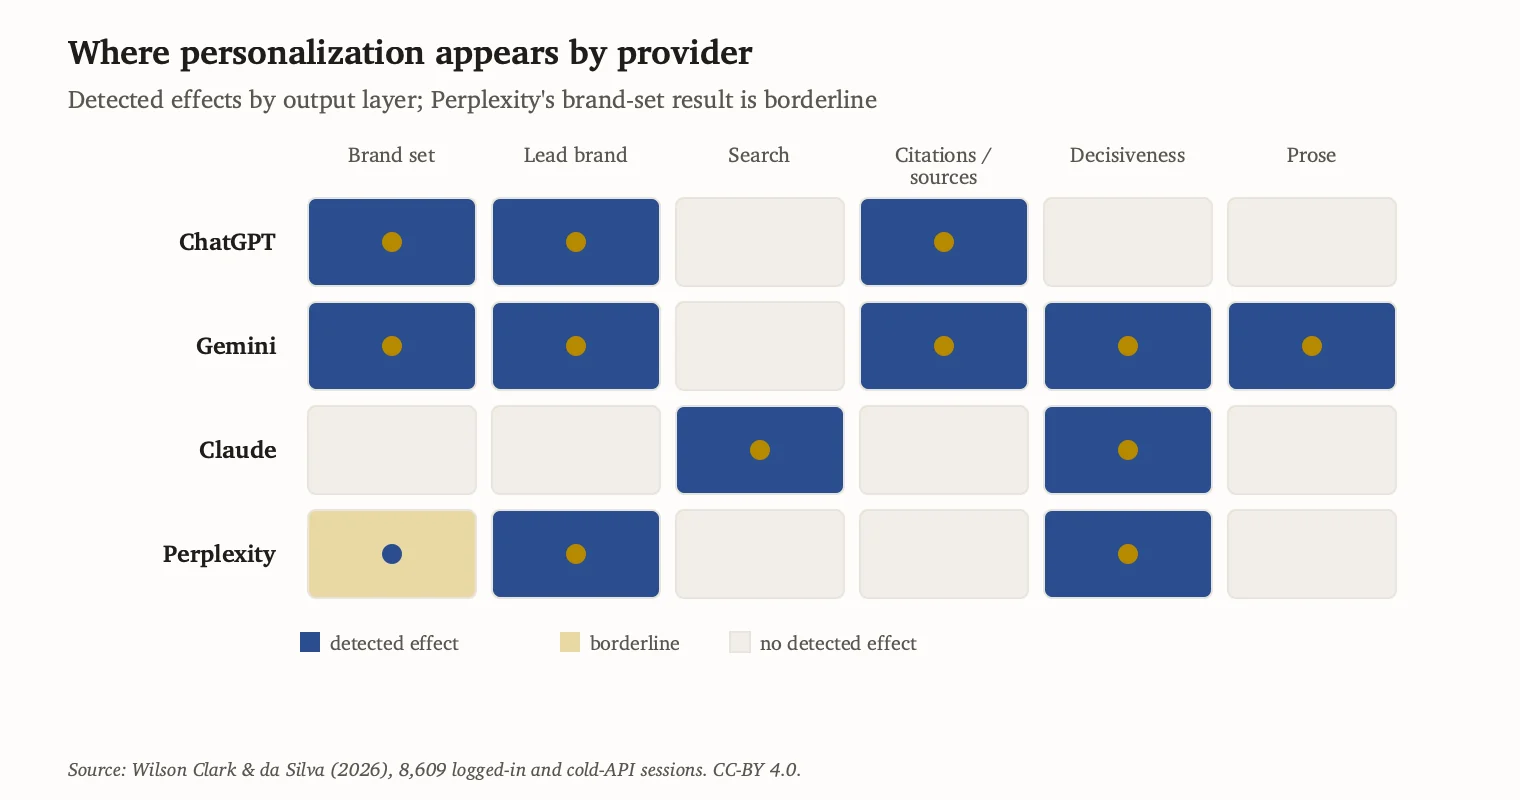
The five segments summarize the relative size of the observed movement within each characteristic. They are an editorial aid, not a new scientific score. The result label and statistic state whether the evidence was clear, borderline, not detected, descriptive or unavailable. The bars should not be combined into an overall provider rating.
ChatGPT: The shortlist editor
ChatGPT mainly personalized the recommendation itself: which brands appeared regularly and which one appeared first. [Example: one brand enters the recurring shortlist, while another replaces the previous first recommendation.]
| Characteristic | Signal | Result |
|---|---|---|
| Recurring brands | ●●●●○ | Clear: +16.0 percentage points, p < 0.001 |
| First recommendation | ●●●●○ | Clear: +25.9 points, p < 0.001 |
| Search specificity | ●●○○○ | Borderline: +9.2 points, p = 0.070 |
| Answer focus | ●○○○○ | No detected change: 0.07 fewer brands, 95% CI [-0.60, +0.44] |
| Evidence selection | ●●●●○ | Clear for consulted sources: +23.8 points, p < 0.001; cited-domain change was not detected |
| Local citations | ●●●○○ | Descriptive: strict .uk citations rose from 10% to 16% |
Claude: The focused researcher
Claude changed how it researched the answer and returned fewer choices, but its recurring brands and first recommendation remained similar. [Example: Claude searches for "[brand] reviews" instead of a general category query, but arrives at a similar recurring shortlist with about one fewer brand.]
| Characteristic | Signal | Result |
|---|---|---|
| Recurring brands | ●○○○○ | No detected change: +1.0 point, p = 0.412 |
| First recommendation | ●○○○○ | No detected change: -0.3 points, p = 0.530 |
| Search specificity | ●●●●● | Clear: brand-naming searches rose from 8% to 18%, p < 0.001 |
| Answer focus | ●●●●○ | Clear: 0.75 fewer brands, 95% CI [-1.17, -0.39] |
| Evidence selection | ●○○○○ | No detected change |
| Local citations | ●●○○○ | Descriptive: strict .uk citations rose from 0% to 2% |
Gemini: The broadest personalizer
Gemini changed the recurring shortlist, first recommendation and supporting evidence. It produced longer answers around fewer brand choices. [Example: Gemini recommends a different group of brands, puts a different brand first, links to different pages and gives more explanation around fewer choices.]
| Characteristic | Signal | Result |
|---|---|---|
| Recurring brands | ●●●●● | Clear: +33.3 points, p < 0.001 |
| First recommendation | ●●●●● | Clear: +33.3 points, p < 0.001 |
| Search specificity | N/A | Unavailable: the interface did not expose search-query strings |
| Answer focus | ●●●●○ | Clear: 0.68 fewer brands, 95% CI [-1.27, -0.16] |
| Evidence selection | ●●●●○ | Clear for cited domains: +14.8 points, p = 0.004 |
| Local citations | ●●●●● | Descriptive: strict .uk citations rose from 18% to 28% |
Perplexity: The decisive re-ranker
Perplexity changed the first recommendation and returned the narrowest selection of brands. Evidence for a change across the full recurring shortlist was borderline. [Example: the broad shortlist remains similar, but a different brand appears first and the answer recommends three brands instead of four.]
| Characteristic | Signal | Result |
|---|---|---|
| Recurring brands | ●●○○○ | Borderline: +7.2 points, Holm-adjusted p = 0.067 |
| First recommendation | ●●●○○ | Clear: +11.7 points, p < 0.001 |
| Search specificity | ●○○○○ | No detected change |
| Answer focus | ●●●●● | Clear: 0.90 fewer brands, 95% CI [-1.28, -0.54] |
| Evidence selection | ●○○○○ | No detected change |
| Local citations | ●●○○○ | Descriptive: strict .uk citations rose from 17% to 19% |
Local citations measure cited domains ending in .uk, not every locally relevant source. The provider figures are descriptive. Across all four providers, the increase from 11% to 17% was statistically confirmed (+6.0 points; 95% CI [+0.6, +12.4]).
Presence and position are separate outcomes. Two account types can retain many of the same brands while placing a different one first. The percentage-point figures show movement beyond each provider's normal variation; they are not the share of all prompts where a brand changed.
These findings describe the provider models and consumer surfaces tested during June 2026. They should not be read as permanent provider rankings. The study did not measure clicks, purchases or revenue.
4. What API and logged-in measurement captured
One neutral temporary response recovered 62.9% of the history-primed recurring shortlist. One cold API response recovered 53.0%. Both improved with repetition, but they followed different curves.
At sixteen responses, neutral Temp reached 94.7% recall and the cold API reached 79.1%. The curves were still moving, so the study establishes a gap through sixteen responses rather than a permanent ceiling.
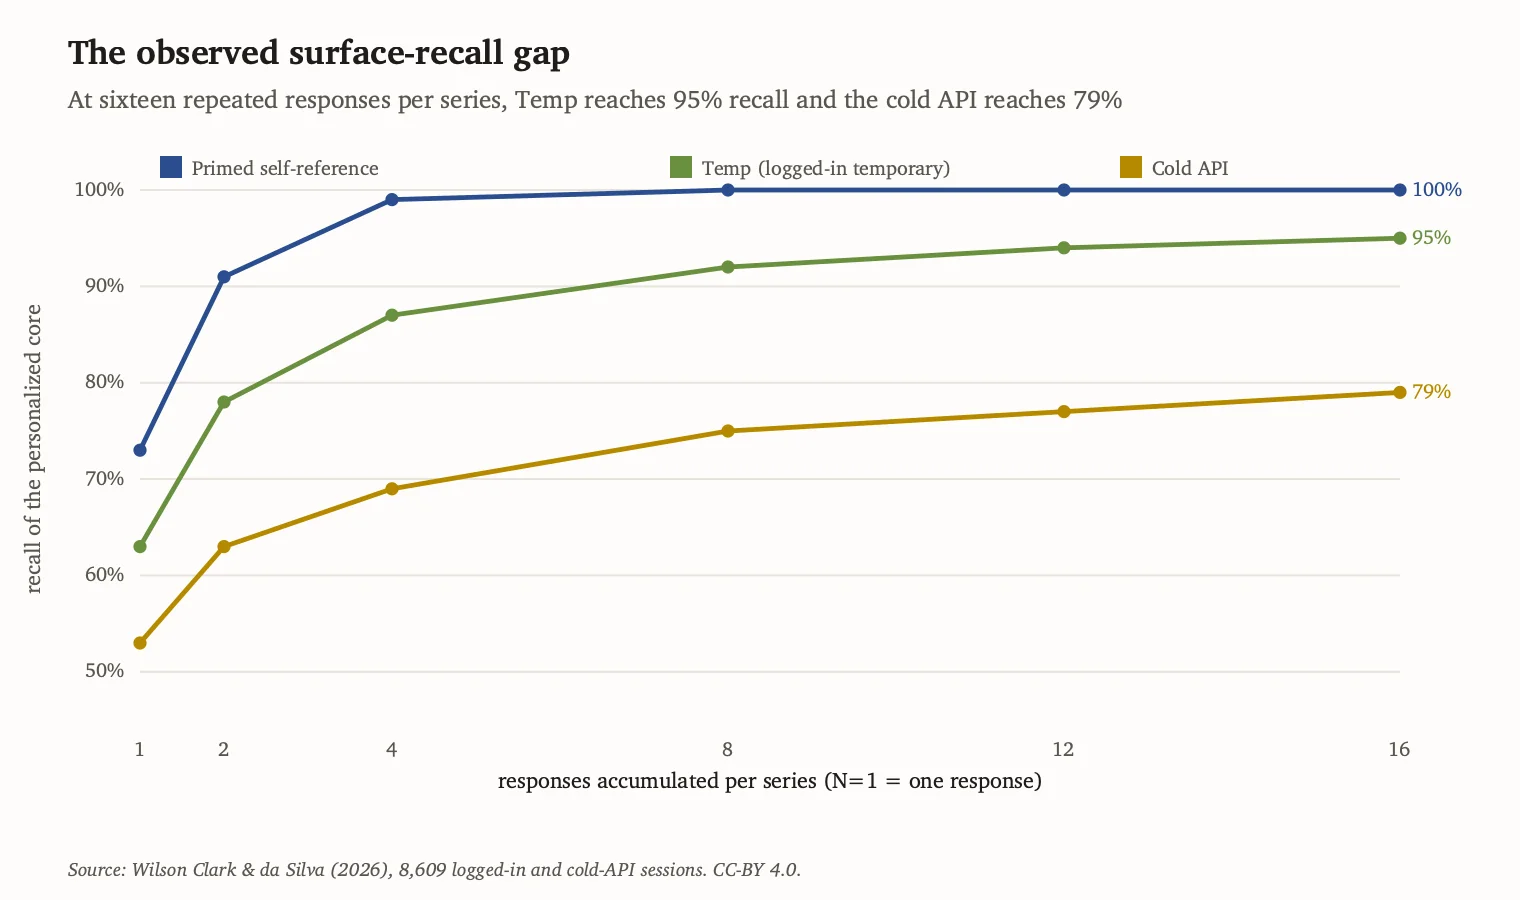
| Responses per series | History-primed reference | Neutral Temp | Cold API |
|---|---|---|---|
| 1 | 72.6% | 62.9% | 53.0% |
| 2 | 90.8% | 78.0% | 62.7% |
| 4 | 98.9% | 87.3% | 69.3% |
| 8 | 100.0% | 91.9% | 74.6% |
| 12 | 100.0% | 93.7% | 77.3% |
| 16 | 100.0% | 94.7% | 79.1% |
Recall here means overlap with the recurring shortlist observed in the history-primed account. It is a measure of surface fidelity, not a score for factual accuracy or recommendation quality. The history-primed experience is the reference because the study asks what history-free collection may miss, not because every personalized recommendation is correct.
The comparison uses the same 173 matched cells at each plotted depth. At the sixteen-response endpoint, those cells contained 5,840 distinct responses. Extending the curve to cells with more observations would have changed the population, so the paper stops where a like-for-like comparison was still possible.
Stability depended on the provider and surface
The API recurring shortlists had a narrow 77% to 82% stability range. Neutral Temp ranged from 54% to 79%, while history-primed sessions ranged from 56% to 75%. The calculation split each repeated series into two halves and compared the recurring sets across 200 seeded splits.
| Provider | Cold API | Neutral Temp | History-primed |
|---|---|---|---|
| ChatGPT | 82% | 68% | 75% |
| Claude | 80% | 79% | 72% |
| Gemini | 77% | 72% | 73% |
| Perplexity | 78% | 54% | 56% |
Perplexity showed the sharpest contrast: 78% stability through the API, 54% in neutral Temp and 56% in history-primed sessions. Repeatability on one route cannot be assumed for another. These percentages describe stability, not factual accuracy or recommendation quality.
The routes also gathered evidence differently. The cold API cited brands' own domains in about 67% of answers, compared with roughly 4% on the logged-in surface, and it ran about eleven searches per answer rather than about one. Those figures describe the tested configurations. They do not establish that one source mix was preferable.
5. Geography, sources and further patterns
In the controlled UK market, history-primed sessions shifted the aggregate mix toward UK and European brands. The share rose from 23% to 30%, while the US-origin share fell from 67% to 62%. Citations on strict .uk domains rose from 11% to 17%.
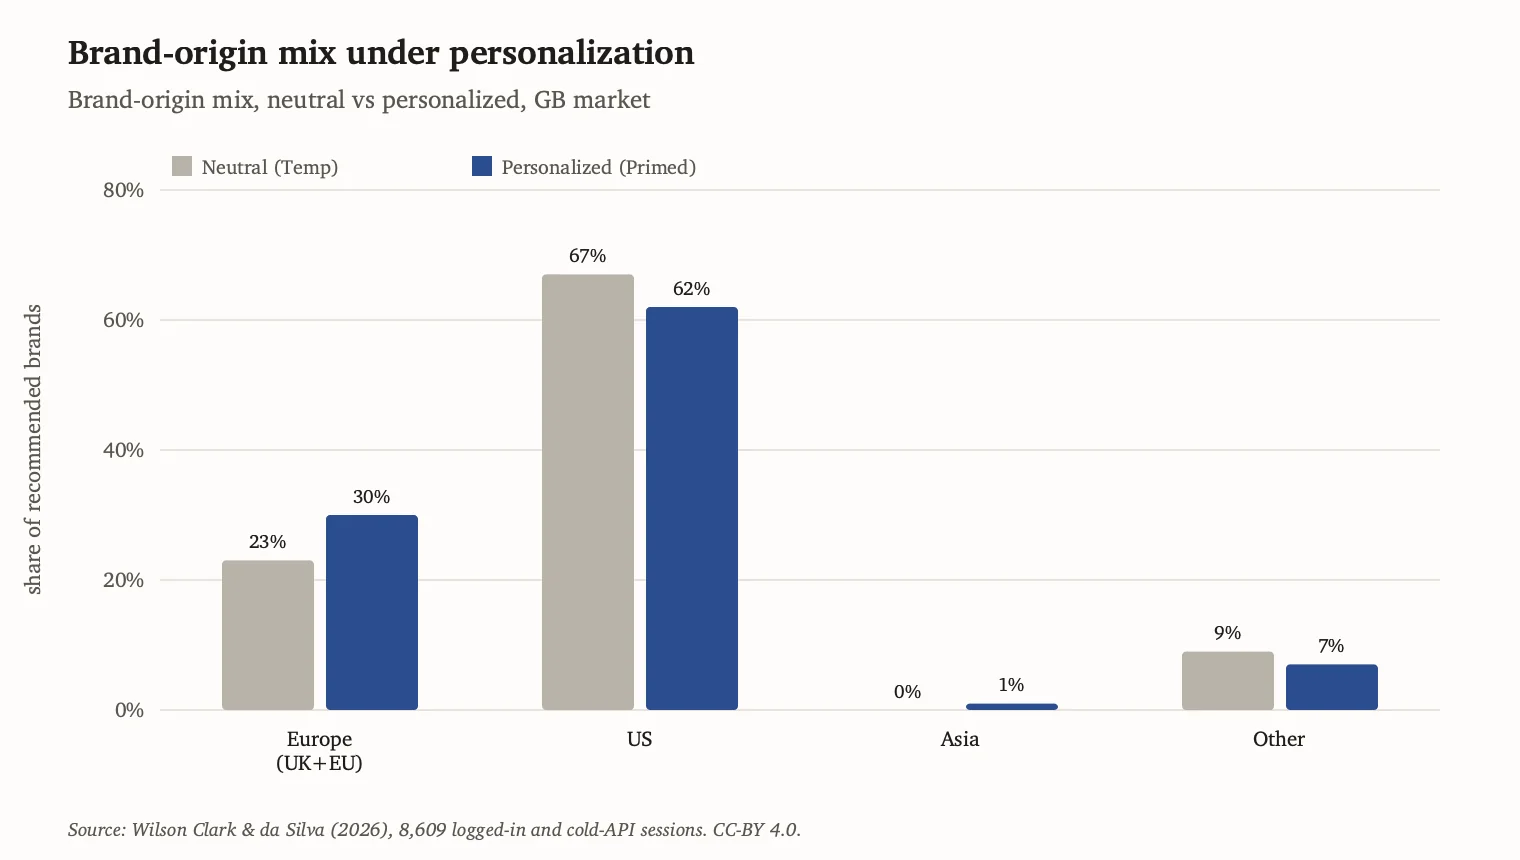
Brand origin and page location answer different questions. A European brand can appear with a global domain, while a US brand can be supported by a UK page. The strict .uk measure also excludes UK-facing pages on .com domains or paths such as /en-gb, which makes it a conservative measure of page location.
Individual brands moved in both directions. The finding is a change in the aggregate mix for the tested UK users, not a guarantee that every local brand gained visibility. A study in other markets is needed before treating the pattern as a general localization rule.
Sources shown and sources consulted
History-primed answers used about 0.4 more cited domains and 2.9 more consulted sources per answer. Cited sources appeared as links in the answer. Consulted sources were retrieved or searched whether or not the link was shown.
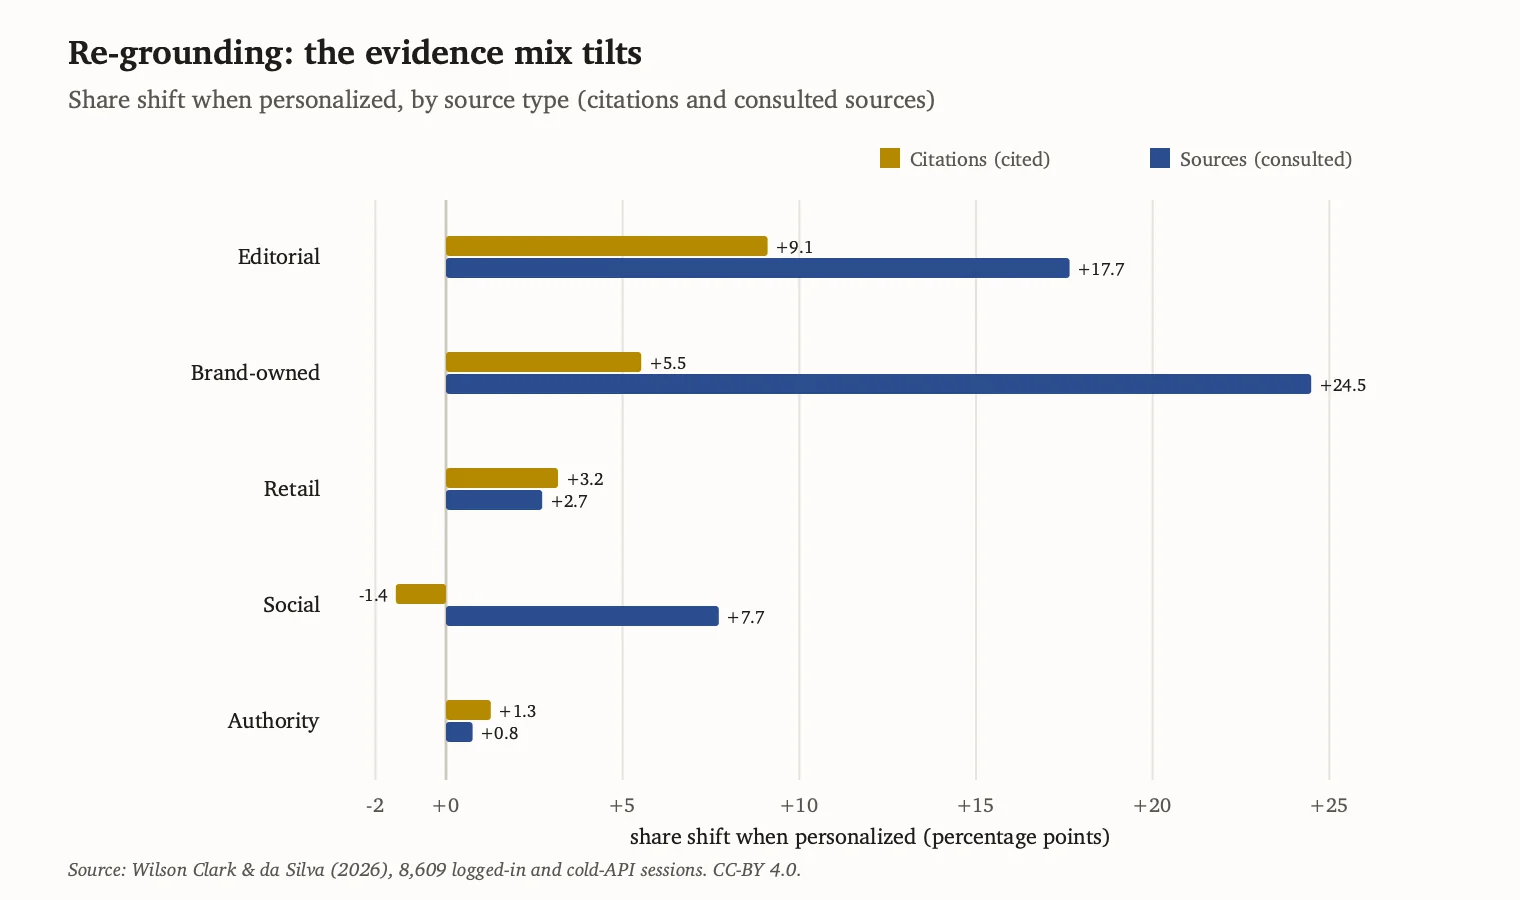
| Source type | Change in share shown as citations | Change in consulted-source share |
|---|---|---|
| Editorial | +9.1 points | +17.7 points |
| Brand-owned | +5.5 points | +24.5 points |
| Retail | +3.2 points | +2.7 points |
| Social | -1.4 points | +7.7 points |
| Authority | +1.3 points | +0.8 points |
These source-type splits are exploratory. A source consulted during retrieval is not necessarily a citation visible to the user, so the two columns should not be combined.
Exploratory category and purchase-stage patterns
Gemini had its largest category results in children's gifts and HR software. ChatGPT moved most clearly in HR software and skincare. Perplexity showed an HR software result. Claude had no detected positive category-level result.
| Provider | Skincare | HR software | Children's gifts |
|---|---|---|---|
| ChatGPT | +14 points | +22 points | +11 points (weaker) |
| Gemini | +7 points (borderline) | +36 points | +47 points |
| Claude | Not detected | Not detected | Not detected |
| Perplexity | Not detected | +20 points | Not detected |
Purchase-intent questions moved most, followed by best-of and comparison questions, then broad how-to questions. The category tests were uncorrected, and the paper does not publish a numeric funnel-stage matrix. These are questions for follow-up research, not general rules. The ChatGPT children's-gifts result is labelled weaker and the Gemini skincare result borderline because their two-sided intervals crossed zero.
6. Implications for measurement with controlled account histories
The results support treating account context as an explicit condition of AI visibility measurement. A neutral baseline remains useful for comparison, but it does not establish how recommendations behave under other account conditions.
Accounts with controlled histories offer one way to investigate this variation. Researchers can ask the same questions across defined account contexts and compare recurring recommendations, ordering and supporting sources. Repeated observations and a neutral reference are necessary to distinguish persistent differences from ordinary variation.
The present study establishes differences between neutral and history-primed conditions for some providers. It does not establish that every profile produces a distinct recommendation pattern, or that a synthetic profile represents the average experience of a customer segment. Those questions require comparisons between profiles, replication across independently prepared accounts, and validation against appropriately collected observations from real users.
The next methodological question is how much additional information account histories provide beyond neutral collection and explicit persona descriptions. Evaluating these approaches together would help determine when the preparation and maintenance of primed accounts are justified.
Neutral temporary collection recovered 94.7% of the history-primed recurring shortlist at sixteen responses. That substantial overlap makes repeated neutral collection a useful baseline, while differences in ordering and sources remain separate measurement questions.
Measurement must account for both variation between repeated answers and differences between collection conditions. Repetition helps estimate the first; comparisons across defined account conditions investigate the second.
- Collect repeated answers. A recurring pattern is more useful than the brand list from one response.
- Document account context. Report the model, question, market, measurement surface and account-history condition.
- Compare defined histories. When account history matters to the question, compare prepared accounts against a neutral reference.
- Report confidence. Confidence should reflect how consistently a result repeats on that provider and surface.
- Keep provider results separate. Providers can change the shortlist, first position, sources or search behavior in different ways.
- Validate audience relevance. Test how controlled profiles correspond with real users before treating results as estimates for customer segments.
The practical rule
Match the collection method to the question. Keep a repeated neutral baseline, document the account context and test defined histories where they may affect the result. Report the observation count and uncertainty alongside each provider's findings.
Read how to measure AI visibility
Research record
How the study was run
| Item | Detail |
|---|---|
| Categories | Skincare, HR software and children's gifts |
| Collection design | 2,160 cold API, 2,160 neutral Temp and 4,320 history-primed collections scheduled |
| Location | All API and browser traffic originated from UK IP addresses |
| Primary analysis | 164 eligible prompt-persona-provider comparisons |
| Recall analysis | 173 matched comparisons at an equal depth of sixteen responses per series |
| Completion | 8,609 of 8,640 scheduled responses succeeded, or 99.6% |
The history-primed arm was larger because both personas in each category had their own controlled account history. The analysis built a recurring shortlist from repeated answers, estimated normal variation separately for each provider, and tested whether the account-type difference exceeded that baseline. Uncertainty was evaluated with prompt-clustered confidence intervals and permutation tests.
Limits and disclosures
- Version 1.0 is not peer reviewed.
- The study covered one UK market during a nine-day collection window.
- The six personas were controlled cases, not a representative sample of all users.
- Provider routing and other internal platform behavior were not observable.
- Neutral temporary and history-primed sessions used separate standardized accounts.
- The design cannot isolate history from every account-level or regular-versus-temporary session-mode difference.
- Collection ended after a descriptive review on day nine. Reported inference was not adjusted for that adaptive stopping decision.
- Category, funnel-stage and detailed source findings are exploratory.
- Recall measures similarity to the history-primed surface, not recommendation quality.
- Public evidence is aggregate. Response-level derived data and proprietary extraction code remain private.
Paper and public evidence
This web edition updates the title and discussion of the August 29, 2026 report. The linked PDF, evidence and citation refer to the deposited Version 1.0.
- Full paper, Version 1.0 (PDF)
- Protocol as executed
- Aggregate evidence
- Claim-level provenance
- Checksums
- Zenodo record
The public package contains the executed protocol, aggregate values for every published figure and table, claim-level provenance and checksums. Response-level derived data and friction AI's extraction system remain private because they contain proprietary measurement logic.
Authors and competing-interest disclosure
Cassie Wilson Clark is the founder of Cassie Clark Marketing, an AI search visibility consultant, creator of the FSA Framework and host of the Found in AI podcast. She contributed strategy, interpretation and analytical review, and has no operational role at friction AI.
Joao da Silva is a co-founder of friction AI. He led the study's design and execution, including collection, extraction, analysis and measurement methodology. ORCID 0009-0008-7006-6001
Joao da Silva is a co-founder of friction AI, a commercial AI visibility measurement company. The study examines measurement questions relevant to friction AI's business. Friction AI is developing measurement capabilities related to the methods examined in this study. Cassie Wilson Clark is an independent consultant.
Related analysis
- How to measure AI visibility
- The 15-prompt AI visibility audit
- Which brands ChatGPT recommends
- What is AI purchase intent?
This web edition is licensed under CC BY 4.0, matching the deposited paper.